 An official website of the United States government




Budget Graphs for FY2013 Congressional Justification
History of Budget Authority: Funding Levels by Fiscal Year
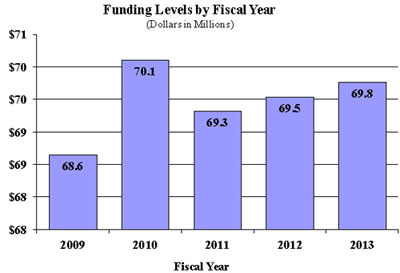
| Description of Graph: Bar Chart of Funding Levels by Fiscal Year | |
|---|---|
| Fiscal Year | Funding Level(Dollars in Millions) |
| 2009 | $ 68.6 |
| 2010 | $ 70.1 |
| 2011 | $ 69.3 |
| 2012 | $ 69.5 |
| 2013 | $ 69.8 |
History of FTEs: FTEs by Fiscal Year
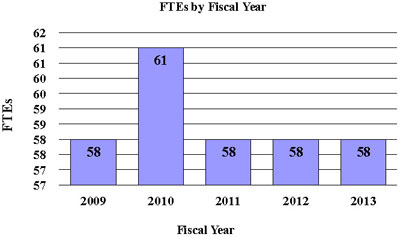
| Description of Graph: Bar Chart of FTE's by Fiscal Year | |
|---|---|
| Fiscal Year | FTEs |
| 2009 | 58 |
| 2010 | 61 |
| 2011 | 58 |
| 2012 | 58 |
| 2013 | 58 |
Distribution by Mechanism: FY 2013 Budget Mechanism
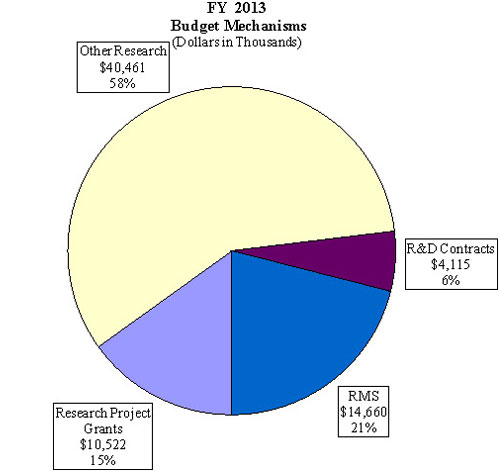
| Description of Graph:Pie Chart of FY 2013 Budget Mechanism | ||
|---|---|---|
| Category | Dollars in Thousands | Percent |
| R&D Contracts | $ 4,115 | 6% |
| RMS | $ 14,660 | 21% |
| Research Project Grants | $ 10,522 | 15% |
| Other Research | $ 40,461 | 58% |
Change by Selected Mechanisms: FY 2013 Estimate Percent Change from FY 2012 Mechanism
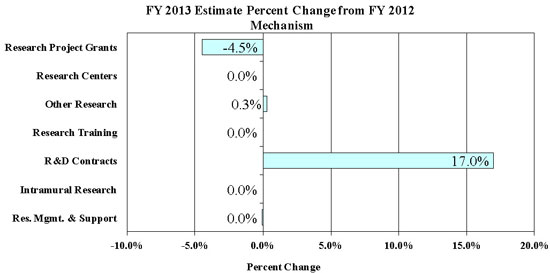
| Description of Graph: Bar Chart of FY 2013 Estimate Percent Change from FY 2012 Mechanism | |
|---|---|
| Category | Percent Change |
| Research Project Grants | -4.5% |
| Research Centers | 0.0% |
| Other Research | 0.3% |
| Research Training | 0.0% |
| R&D Contracts | 17.0% |
| Intramural Research | 0.0% |
| Research Management and Support | 0.0% |