 An official website of the United States government




Scientific meetings are an important venue for disseminating findings, but space and time for experimental design details is often limited. Thus, to facilitate increased transparency in scientific presentations, rigor icons can quickly and easily convey experimental design details as described in this paper .
Rigor icons are simple symbols that can be added to figures to easily convey important experimental design details in scientific presentations.
Different sets of rigor icons will be valuable to different communities. However, a core set of reporting standards , including measures to minimize the risk of bias, are integral experimental design elements that are broadly applicable.
A proposed set of fundamental rigor icons is presented below:
| Rigor-related item | Description | Icon |
|---|---|---|
| Blinding/Masking | Experimenters were blinded/masked to treatment during experimentation and analysis | |
| Randomization | Samples were randomly assigned to experimental groups | |
| Sample Size Estimation | Sample size/power was calculated in advance | |
| Data Exclusions | Outliers or other data were excluded according to pre-defined criteria | |
| Exploratory Experiment | This experiment or analysis was exploratory, observational, or hypothesis-generating | |
| Data Accessibility | Data/code/analysis pipelines are available in a public repository |
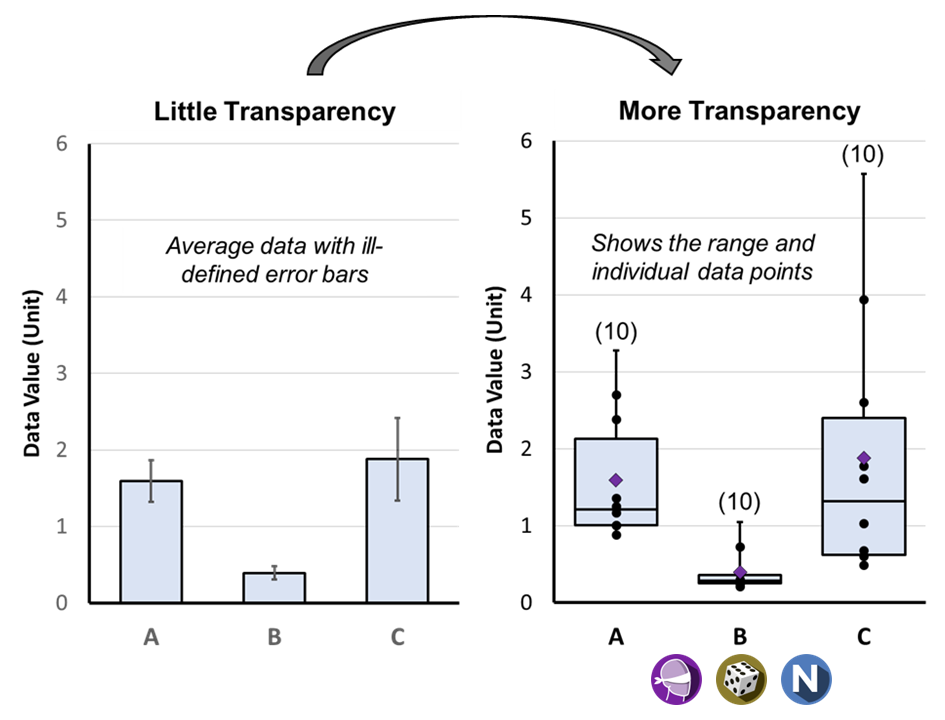
Adding rigor icons to figures in scientific presentations maximizes data transparency and provides important information without taking up additional space:
Additional Resources:
-
2023-11-10%20Rigor_Icons_One_Pager_508c.pdf (356.89 KB) describing the icons in more detail - File repository with the individual icons, the descriptive flyer, and a presentation slide
- Presentation by NINDS Director Walter Koroshetz about using the icons (starts at 00:43:58)