An official website of the United States government




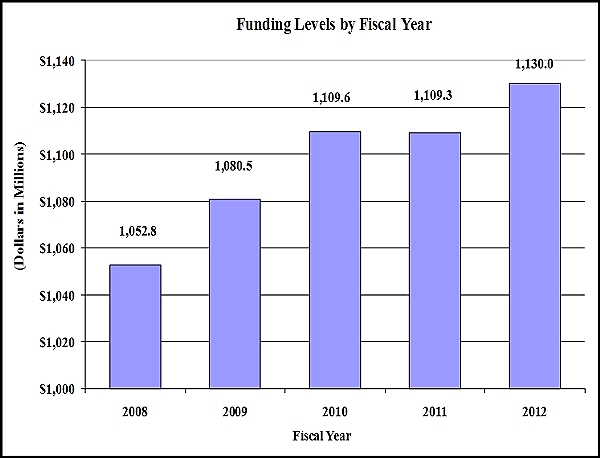
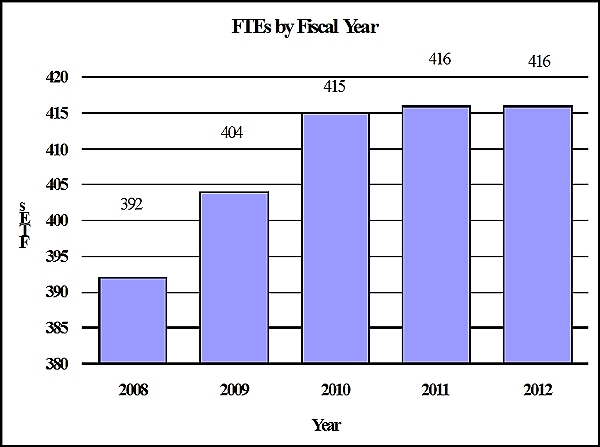
The following graphs show the Funding Levels by Fiscal Year, and the FTEs by Fiscal Year.
Image
Image
Image
Image